

Section 04 · Sequencing the Program
Method4.1
Rank the gaps
Rank the gap records so the most consequential come first. Every record is compared on the same dimensions: how severe the gap is, how many people it affects, how much it matters to each objective, and how close it is to the subject. Choose a method to combine them and record its settings.
Dimensions of the rank
- Gap severity
The verdict: Severe or Moderate.
- Demand affected
The population of the area the gap affects. A gap that fails more people ranks above one that fails fewer, all else equal.
- Priority
How strongly the area scores under each connection objective, one dimension per objective, whether or not it was designated under that objective.
- Distance to the subject
Closer ranks first: expected access rises as distance falls, so a gap next door is the starker failure.
- Judgment (optional)
Any further dimension the study declares: a rating with a reason on each record, for what the other dimensions cannot see. An unrated record is neutral, never penalized.
Two methods, one table
- Sort
Order the dimensions by importance and compare records on the first, then the next where they tie. Use it when one dimension should decide before any other is consulted. Record the order.
- Score
Give each dimension a weight and take the weighted mean of the dimensions on a common scale. Use it when no single dimension should decide the order. Record the weights; they are the study's statement of what it values.
Flux walkthrough4.1
Choose a method and weight the dimensions
Colorado Connector Fort Collins, Colorado · CO Base
Choose Sort or Score
The Review stage lays out every gap record with its severity, distance to the subject, population, and score under each connection objective. We chose Score, because no single dimension should decide the order and we wanted the weights on the record.
Weight what the study values
Every dimension starts at ×1. Raise the ones the study exists to serve and leave the rest; each weight is shown in the column header and saved with the ranking. We set Travel to CoCo station areas to ×3, since connecting the places that generate travel to the other Colorado Connector stations is what the service is for, and kept everything else at ×1.
That weighting put the gaps at East Harmony Drive and East Mulberry Street at the top, led by Harmony’s service frequency (Severe).
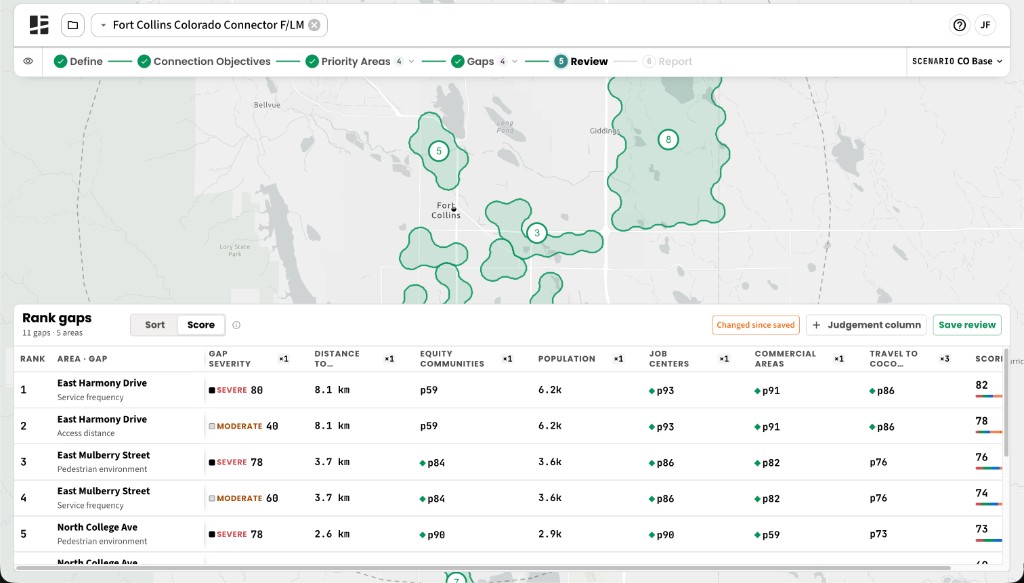
Each row shows the readings behind its score.
Record the basis and save
Where a position needs a reason the dimensions do not carry, add a judgment column and write it against the record. We needed none here. Saving the review fixes the method, the weights, and every score, so the order can be reproduced and explained.