

Section 03 · Diagnosing Access Gaps
Method3.2
Record gap verdicts
Take the selected assessments one at a time. For each, examine its evidence for every Priority Area, look closer with other data and local knowledge wherever the evidence points to a problem, and record a verdict: Not a gap, Moderate, or Severe.
From evidence to record
- Examine every area
Treat the evidence as a prompt. Where it points to a problem, look closer before deciding. An area the evidence can’t speak to is unassessed, not clear.
- Record the verdict with its evidence
Keep the figure the verdict was based on, and note why the verdict was made, especially where your judgment departs from the figure.
- One record per gap
Each Moderate or Severe verdict is its own record: one area, one assessment.
Flux walkthrough3.2
Record a verdict for every area, one assessment at a time
Colorado Connector Fort Collins, Colorado · CO Base
Read the suggested verdict
The stage opens one assessment and steps through every Priority Area. For each, it displays the evidence, reports the reading, and suggests a verdict. Accepting moves to the next area; once every area carries a verdict, the next assessment opens.
For Pedestrian environment at North College Ave, the reading was a mean walk comfort of 0.62 across the area’s six cells. The suggestion was Moderate.
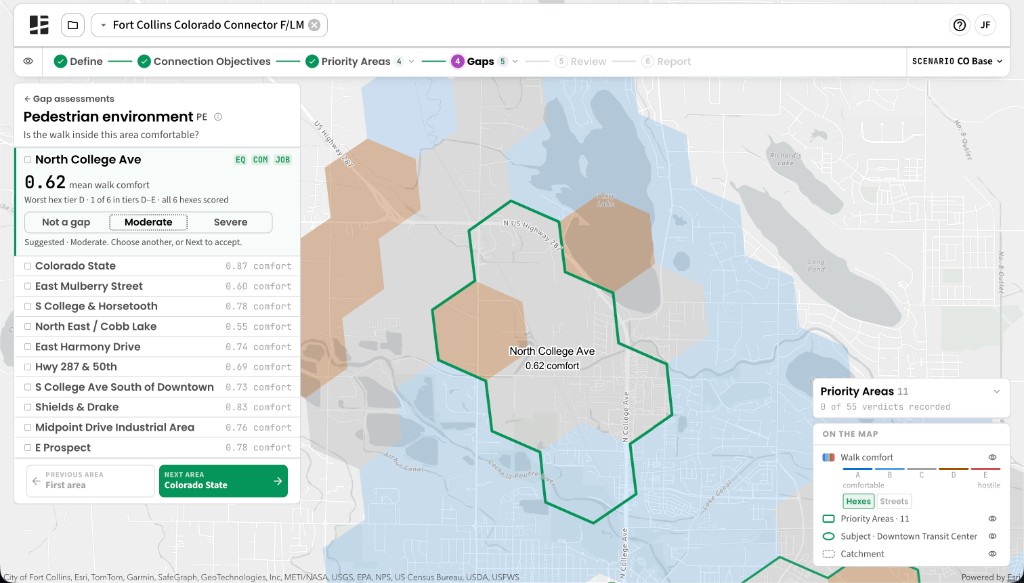
The suggestion is a prompt; the verdict is ours.
Look closer before accepting
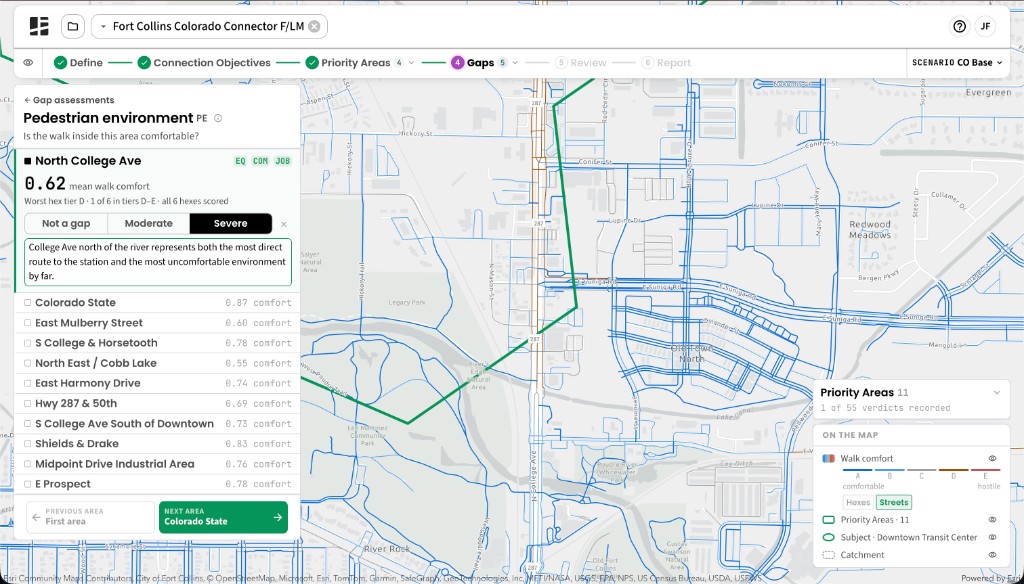
The suggested verdict reflects the area as a whole. A reasonable average can hide a single route that fails, and the route that matters most is the one people would actually take to the subject. Before accepting, check conditions along those routes and weigh what you know of the place.
At North College Ave, switching the map from cells to streets showed that College Ave north of the river is both the most direct walk to the Downtown Transit Center and by far the most hostile: fast traffic, multiple lanes, and no shade. We raised the verdict to Severe and recorded why in the note, so the decision stays clear to anyone who later sees the 0.62 average.
Complete the set
Repeat until every area has a verdict on every selected assessment. Each Moderate or Severe verdict becomes a gap record carrying its evidence and note into Review.
Across 11 areas and four assessments we recorded 44 verdicts.
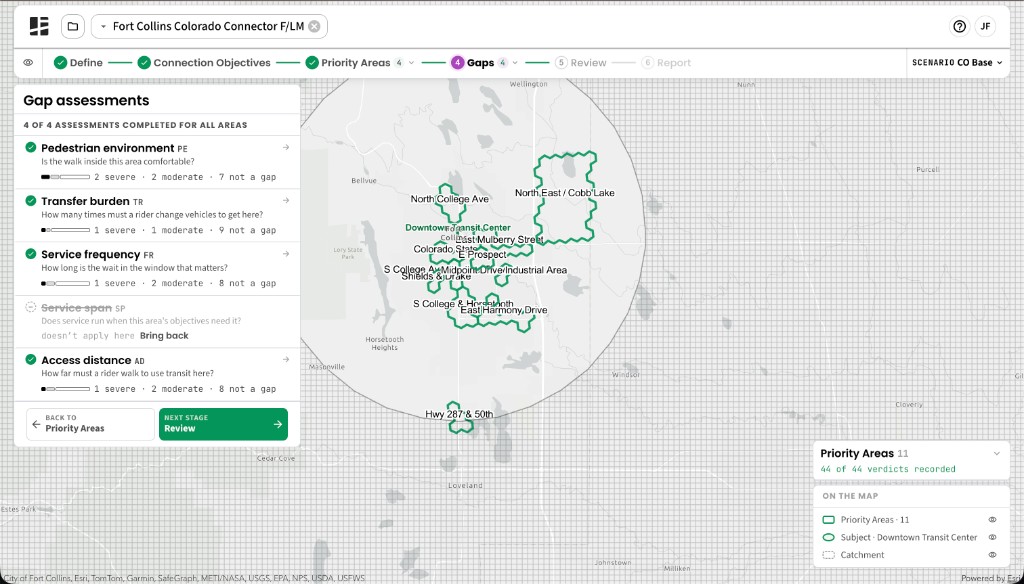
Review opens once every area carries a verdict on every selected assessment.